The most frequent checkout error cost zero euros
An Italian WooCommerce store, about 2,400 products, was losing orders at the checkout and nobody could say where. The owner had a list of guesses from customers who phoned; the previous vendor had a different list. Neither was data.
Step one was to make the checkout observable without making it a privacy problem: a small plugin that records where and why a checkout attempt stops, with the session stored as a hash and email addresses masked. No names, no card data, nothing that identifies a person. It ran for a few weeks and produced the first real picture of what happens between “place order” and a paid order.
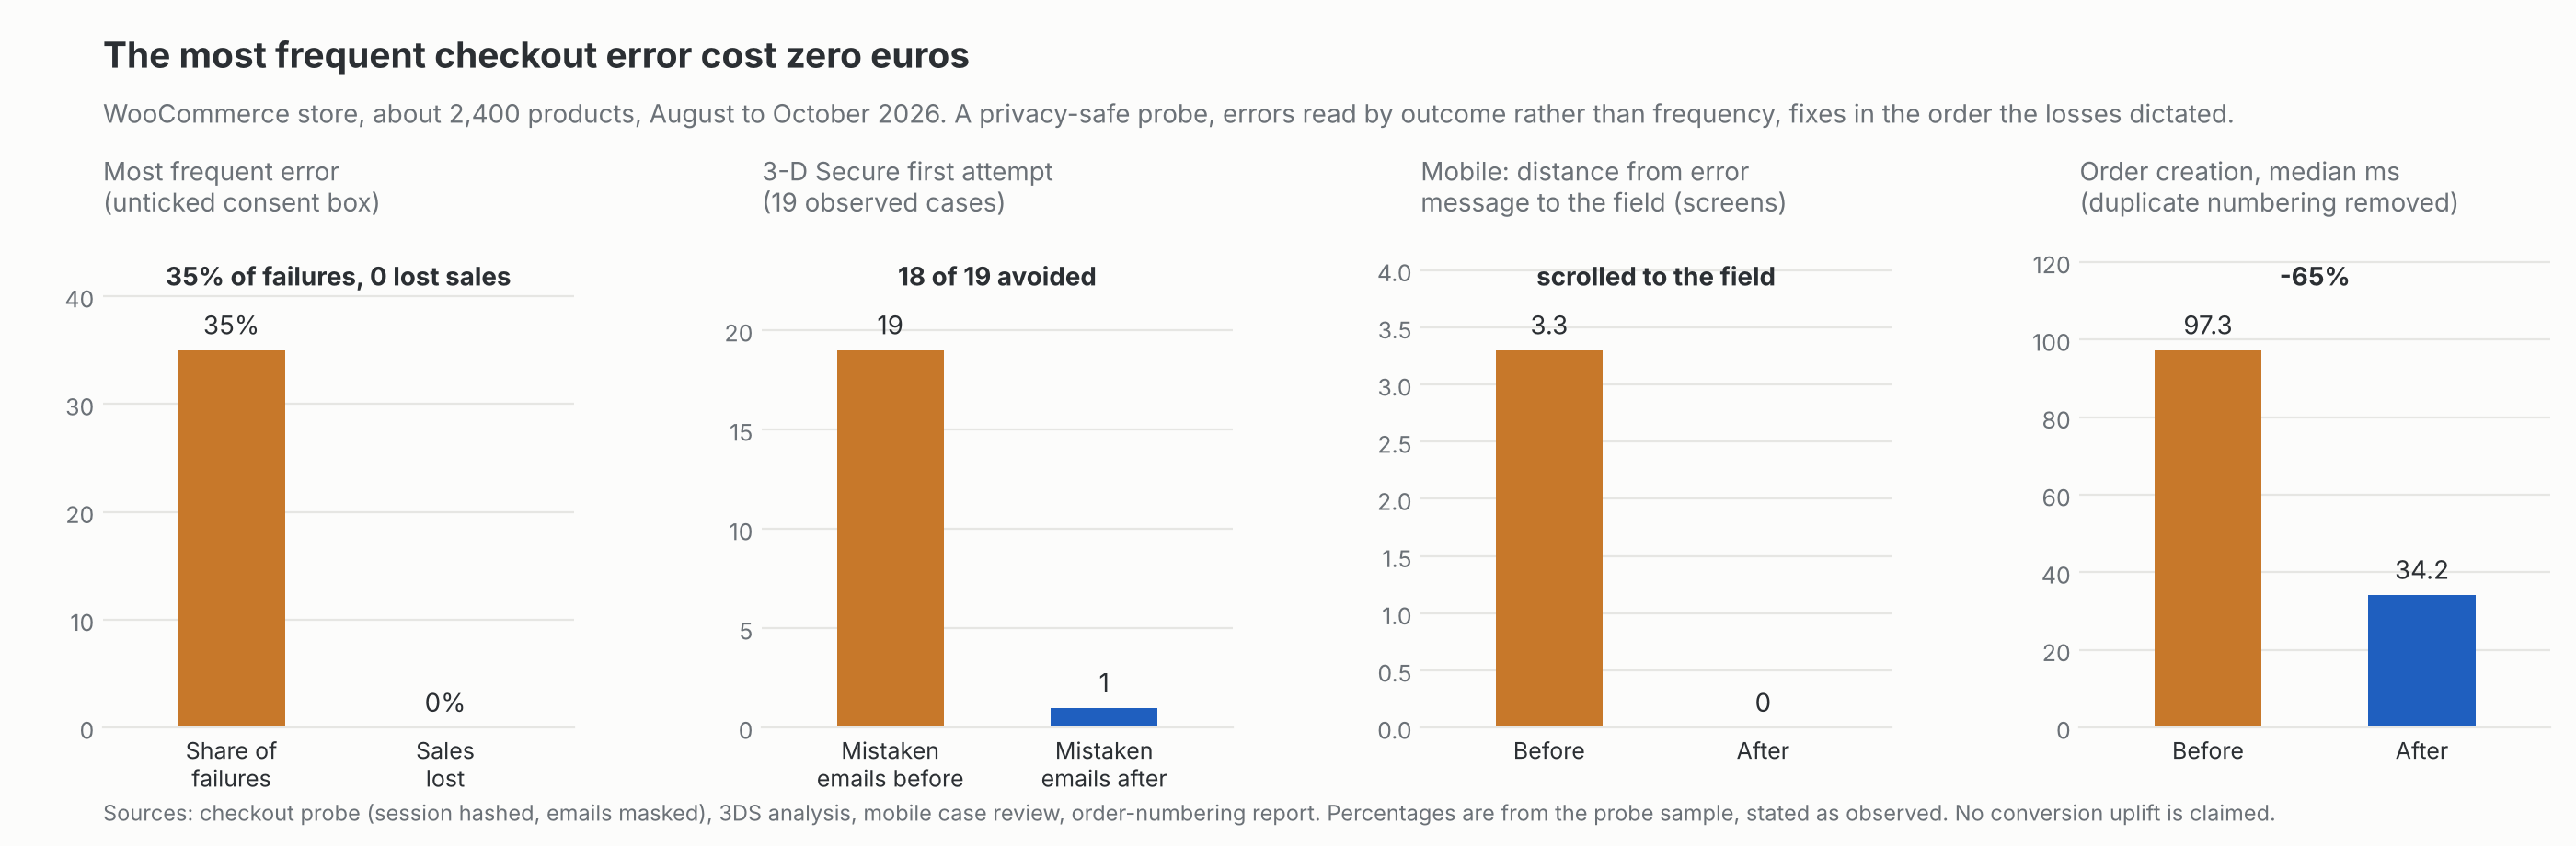
Step two was to read it by outcome, not by frequency. The most frequent error, 35% of all failures, was an unticked consent box. Counted by what happened next, it cost nothing: every customer who hit it ticked the box and completed the order. The errors that actually ended in a lost sale were different and far less frequent. Had the work started from the frequency table, the first weeks would have gone into polishing a checkbox.
What the outcome analysis pointed to
Card payments with 3-D Secure failing on the first attempt. About one card payment in twenty failed the first 3DS challenge and succeeded a few minutes later; in between, the customer received a “payment failed” email and then an “order in progress” email, and some gave up. Reproduced in the local replica with a mock gateway; fixed with a visible waiting page and a delayed failure email, without touching the gateway module; hostile testing of about 150 attempts in four passes before release. Of the 19 observed cases, the delayed email would have prevented 18 mistaken notifications.
Errors on mobile. The validation message and the fields it referred to were 3.3 screens apart on a phone. After the fix the customer is scrolled to the field in error.
A PayPal route through the gateway that was not collecting. Fifteen operations all left pending, about 380 euros of orders in five days. Found in the probe data, stopped the same day, ticket to the gateway with the evidence attached.
Order creation time. Two order-numbering systems were running in parallel; the duplicate was removed and the median went from 97.3 to 34.2 ms.
Shipping rules read from the database, not from the admin panel, and verified on 348 orders: with certain coupons, in-store pickup was left as the only option. An 11 MB plugin serving five rates replaced by a few lines of code, with a 17-cart matrix identical before and after and a real Europe zone of 26 countries.
Why it matters
Checkout work is usually sold as a redesign. This was a measurement: a probe, a reading by outcome, and fixes in the order the losses dictated. The budget went where the money was leaking, not where the complaints were loudest.
Limits
The probe sample covers a few weeks of a mid-size store; percentages are from that sample and are stated as observed, not projected. No conversion-rate uplift is claimed because no controlled comparison was run. The checkout loss estimate in euros is not quoted: the project documents mark it as an upper bound on a small sample.
Anonymised at the client’s request.